
Visualization of the Delivery Capacity for Warehouses
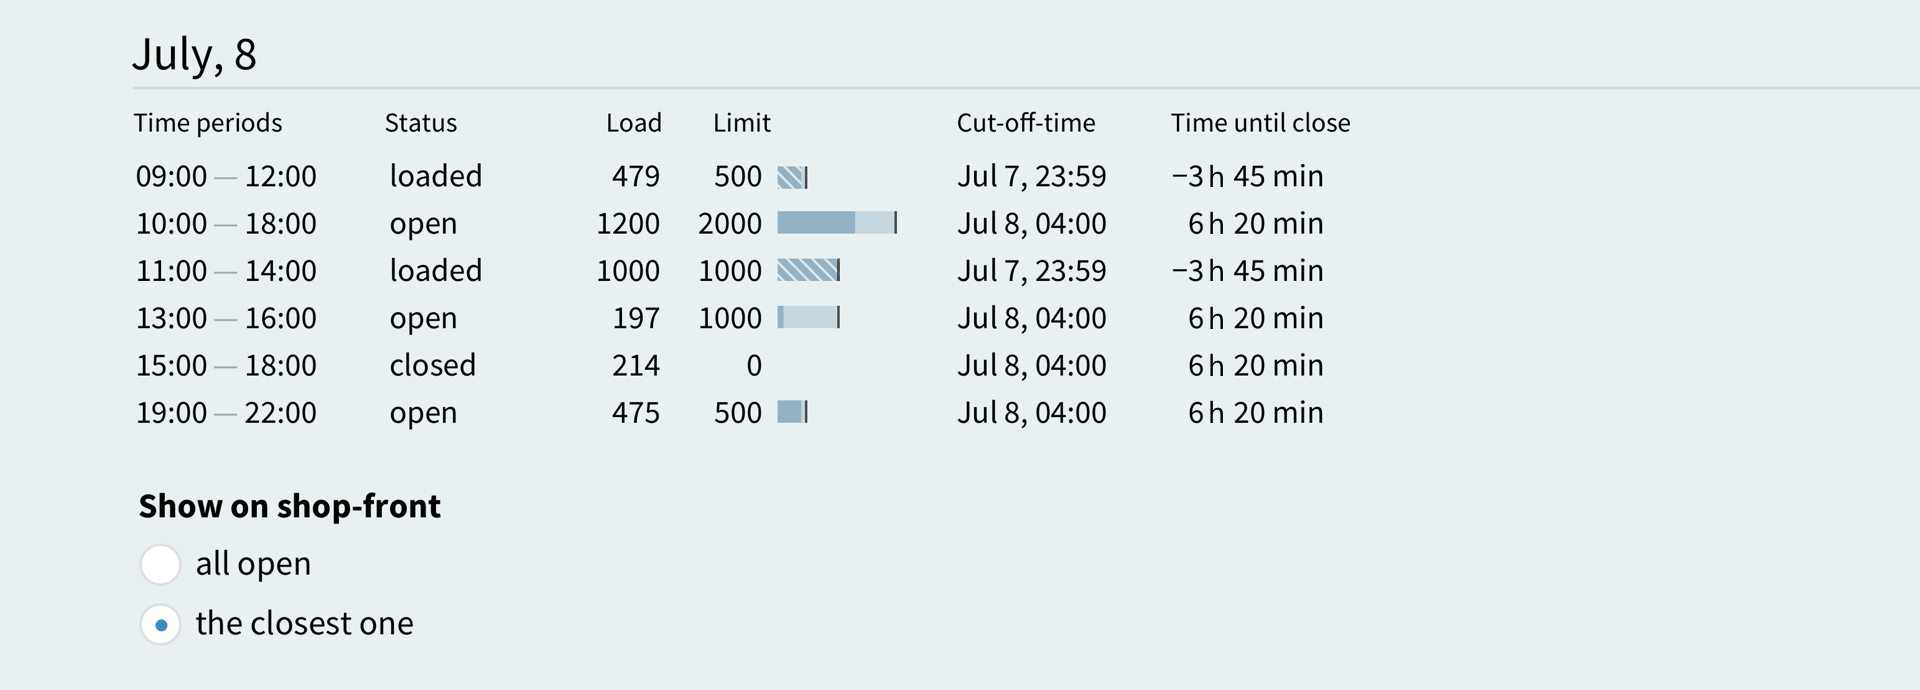
To achieve this goal we invented a concept called time slots. A time slot is a combination of time intervals with their workload levels, limits of delivery options, and the time after which a slot should be closed for ordering.
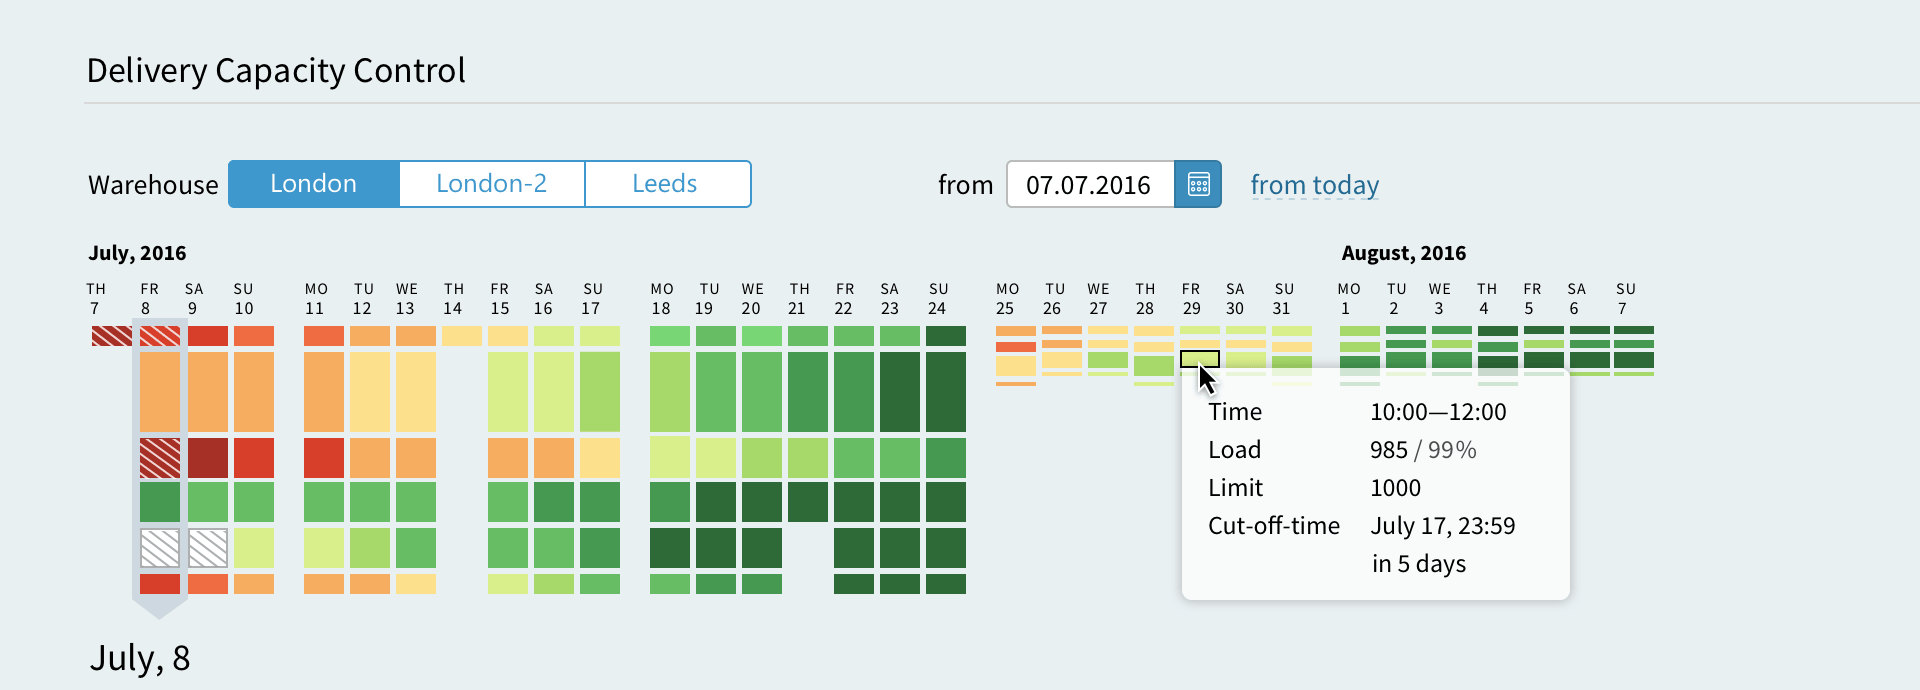
We designed a calendar heatmap for visualizing slot availability. It consists of time slots, the capacity and workload of each slot and the shipping date. Thus, the diagram shows the throughput of delivery options and a workload level of a particular time period.


The client has new software to visualize and control the workload level for each delivery option. Client’s managers see all problem spots and can make an immediate informed decision. For example, they can disable an overloaded delivery option or increase the capacity of a particular time period.
